
Buffer Overflows in the Modern Era - Part 2
Welcome to Part 2 of our Buffer Overflow Series! I plan on diving in right where we left off last time, so if you just finished Part 1, this should all click pretty easily. Using our trusty x64dbg debugger, we determined the memory address within a specific function call that we needed to load in order to execute the calculator. Now, let’s perform an actual buffer overflow and load that same address we referenced in Part 1.
Also I didn’t explain this in great detail in Part 1, but the address I’m using, 0x14000158C, is contained within the function call that loads the calculator, and it comes after some assembly instructions that would align the stack according to standard x64 stack alignment convention. The stack is already aligned before we hijacked this memory address, so I skipped that section of assembly code and moved right to where we needed to be in order to execute the calculator program.
Here’s the python code used to perform a buffer overflow against our vulnerable program. We’re going to do the exact same thing as we did in Part 1, but this time, using code instead of manually manipulating memory addresses using the debugger. We need to send 296 bytes of data to the program to overflow it and reach the execution pointer. You can determine the buffer payload using a variety of methods. I typically just use python and toss junk data at the program until I determine the amount I need to overflow the stack and gain control of RIP. I have the added advantage of knowing the buffer is limited to 275 bytes, since I wrote the vulnerable program 😸 It usually doesn’t take but around 20 - 30 extra bytes added to the original buffer to overflow the stack and reach RIP.
import struct
import subprocess

# Offset to the return address
junk = 296  # junk  (304 bytes)

payload = b"\x41" * junk

payload += struct.pack("<Q", 0x14000158C)

# Run the vulnerable program and supply the payload
process = subprocess.Popen(
    ["C:/Users/robbi/Documents/GitHub/elevationstation_local/overflow3.exe"],  # Replace with the path to your compiled binary
    stdin=subprocess.PIPE,
    stdout=subprocess.PIPE,
    stderr=subprocess.PIPE
)

#uncomment to allow debugging in x64dbg
input("attach 'overflow.exe' to x64Dbg and press enter when you're ready to continue...")

# Send the payload
stdout, stderr = process.communicate(input=payload)

# Output the program's response
print(stdout.decode())
if stderr:
    print(stderr.decode())
Before you run the script, be sure to update this line to reflect your vulnerable program’s path and actual name:
[“C:/Users/robbi/Documents/GitHub/elevationstation_local/overflow3.exe”], # Replace with the path to your compiled binary
Once you’re ready, go ahead and run the python script. You should see the following:
Open x64dbg and click 'Attach', and locate your vulnerable program. Double-click it:
Your program should still have the breakpoints saved and still applied from what you previously set in Part 1 of this series. Go ahead and return to your windows cmd prompt and hit enter to continue your python script’s execution:
Go back to x64dbg, and you should see your code execution land here:
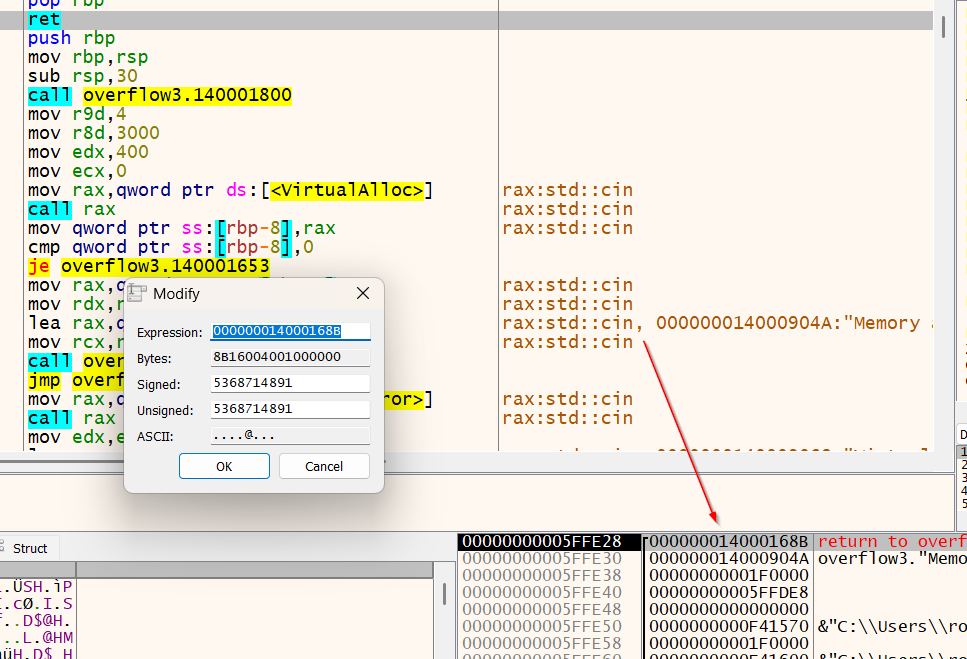
Now, hit F8 two times (fn + F8 if on laptop). Your code instruction execution pointer should now be here:
I’ll reiterate what I mentioned in Part 1 that way it doesn’t go unnoticed. We are selecting this memory address for our breakpoint because it immediately follows the section of our program where it asks for input, and thus, immediately follows our buffer overflow! Also worth reiterating, there is no JMP ESP / JMP RSP used in x64 buffer overflows like we’re accustomed to in x86/32 bit buffer overflows. We are using Return Oriented Programming (ROP), where we take advantage of RET instructions to execute ROP gadgets off the stack.
Also you will NOT see the address of our next instruction in RIP/EIP after successfully overflowing the buffer. You will likely see other registers overflowed with 0x41 though. Whereas in x86 buffer overflows you usually JMP to your memory address using RIP/EIP. It’s just different in x64 due to how registers are laid out. The next instruction will be your ROP gadget, so think of RIP/EIP in terms of the stack and the ROP gadget memory addresses we will “return” to, and not so much what value RIP/EIP holds.
Now, take a look at the bottom right hand corner of your debugger window. You should see the following:
Okay, so we can see quite a few things at this point:
- Our buffer was successfully placed on the stack
- We have control over what instruction will be executed next
- When we hit
ret, we will execute the memory address we added to the end of our buffer in our python code!
I added a reference below if it helps:
junk = 296  # junk  (296 bytes)

payload = b"\x41" * junk

payload += struct.pack("<Q", 0x14000158C) <-- we will be 'returning' to this memory address!
So, we will be using return instructions to jump to the memory address of our choosing, hence the name Return Oriented Programming (ROP). The reason for us using ret instructions for executing our code is due to restrictions enabled on modern Windows versions. The stack does not allow us to change execution (RW-X). Even if you use the VirtualProtect Windows API, the stack remains restrictive toward allowing the execution of assembly instructions we wish to insert onto the stack beyond the original buffer overflow. This restriction is actually at the hardware level to my knowledge. DEP is permanently enabled on Windows 11. I’ll demonstrate ways around this in later posts in this series. It’s not easy, but it’s certainly possible.
Okay let’s move on. Go ahead and hit F8 (function + F8 if on laptop) and you should be here. This should look familiar to you 😸
You guessed it! We’re in our function call that opens the Windows Calculator. Continue to hit 'F8' until you reach the system call that loads the calculator.
Well there you have it. You were able to once again call a function within the vulnerable program, but this time using an actual buffer overflow! So far, we’ve achieved all this while leaving Windows security mechanisms disabled. That will change in due time, but we still have more to learn before we re-enable those restrictions. Next up, I’ll show you how to start using ROP gadgets to build our full buffer overflow exploit and execute shellcode! See you then! 😺
Leave a comment