
Buffer Overflows in the Modern Era - Part 1
Last year I challenged myself to successfully revisit buffer overflows on a fully patched and updated version of Windows 11. Specifically, Windows 11 24H2. The last time I had messed with buffer overflows, and really any form of binary exploitation, was back when x86 stack based buffer overflows were commonplace. Yeah, it had been quite a few years ago and I knew I had a challenge ahead of me. Fast forward to completing my goal of successfully performing a buffer overflow against a windows executable, bypassing Windows Defender, ASLR, and DEP. It was a rush like no other! Needless to say, there is a LOT of content to share on this topic, so this will be a fairly lengthy series. Let’s start with listing some preparatory items you will need to follow along:
- ROP Gadget This will be used to hunt for ROP gadgets for our vulnerable executable
- Ropper This one is also good and easy to setup on Linux. Either of these will work just fine
- x64Dbg To assist in debugging the vulnerable executable
- Lastly, your favorite flavor of Linux to do a number of tasks that are just easier to perform within the Linux environment
- You will want to install
x86_64-w64-mingw32-g++for compiling our vulnerable program
Next, we need to disable all the Windows protections for Part 1 of this series. I want to first show you how the debugger works and of course navigate buffer overflows on Windows 11 without dealing with a bunch of restrictions first. Then, in subsequent posts throughout this series, we will turn on ALL the windows security controls and tackle bypassing DEP and ASLR. I promise! 😸
- Browse to the
'Core Isolation'section in Windows and toggle all of these off (snippit of what it looks like in the image below):
- Next, browse to the
'Exploit Protection'section in Windows and toggle all of those off too (snippit of what it looks like in the image below):
Okay! now we’re ready to proceed 😺
The Vulnerable Binary/Executable
Okay, first things first. We need a vulnerable program to exploit. I’ve crafted just the program and it’s most definitely vulnerable to a buffer overflow. There are a few things to point out here.
- I intentionally include the
win_function()for us to test and make sure we can control our buffer overflow code execution. - Next, I intentionally include the
VirtualAlloc()function as I want to be able to reference it later without having to lookup its address manually. This will make much more sense as we get further along into the series - I add a
char buffer[275];for 275 possible bytes of input. However, I do NOT apply any bounds checking…he he he. 😸 I want 275 possible bytes for the buffer so I can have enough space on the stack for all of our shenanigans. We will use this space for our shellcode, rop gadgets, and other important factors involved in setting up our buffer overflow exploit.
#include <windows.h>
#include <iostream>
#include <cstring>

//compilation instructions on mingw32
//x86_64-w64-mingw32-g++ -o overflow.exe overflow.cpp -fno-stack-protector -no-pie

void win_function() {
    std::cout << "You have successfully exploited the program!\n";
    system("calc.exe"); // Launch calculator as a demonstration
}


void vulnerable_function() {
    char buffer[275]; // medium-size buffer for the overflow
    std::cout << "Enter some input: ";
    std::cin >> buffer; // Unsafe function vulnerable to overflow
}

int main() {
    LPVOID allocatedMemory = VirtualAlloc(
        NULL,  // Address, NULL means it is chosen by the system
        1024,  // Size in bytes
        MEM_COMMIT | MEM_RESERVE, // Allocation type
        PAGE_READWRITE // Memory protection
    );

    if (allocatedMemory != NULL) {
        printf("Memory allocated at %p\n", allocatedMemory);
    } else {
        printf("VirtualAlloc failed with error code %lu\n", GetLastError());
    }
    std::cout << "Welcome to the vulnerable program!\n";
    vulnerable_function();
    std::cout << "Goodbye!\n";
    return 0;
}
Go ahead and compile that:
x86_64-w64-mingw32-g++ -o overflow.exe overflow.cpp -fno-stack-protector -no-pie -static
-fno-stack-protector= disables stack canaries. No canary is inserted which means we can overwrite the return address freely with our buffer overflow-no-pie= Disables PIE (Position Independent Executable) — a form of address space layout randomization (ASLR). Modern compilers generate PIE binaries by default. PIE means the entire binary can and likely will be loaded at a random memory address, making ROP and shellcode harder because you don’t know where functions and gadgets are. With -no-pie, the binary loads at a fixed address, making it easier to:- Know the location of functions
- Use static addresses or relative addresses in our payload
- Create reproducible exploits
If after you compile the executable, you show different memory addresses in x64dbg than those in my screenshots throughout this series, then just go ahead and download the executable. It’s preferable to have exactly what I show in the blog to facilitate a smooth learning experience 😸
Exploring the Debugger
Now that we have the vulnerable program compiled and ready for exploitation, let’s open it up in our debugger of choice, x64dbg. What I want to show you now is how we can reach a function that calls the Windows Calculator, when the code itself intentionally never calls the function. I set it up that way to show how you can manipulate the RIP (instruction pointer) to run our own code and I chose the ubiquituous Windows calculator as my test subject 😸 We will get to the actual buffer overflow exercise in Part 2. Ok, let’s continue!
Click 'File', 'Open' and point to your newly compiled, vulnerable program. Open it
You should see the following:
Now, Click on the 'Run' button:
Click the 'Run' button again, you should see this:
Look at your taskbar. You should see a command prompt asking for input. DON'T ENTER ANYTHING YET! 😄 We want to first set a breakpoint so we can pause the debugger after we enter some input. Scroll down in x64Dbg until you get to memory address 1400015FB.
We are selecting this memory address for our breakpoint because it immediately follows the section of our program where it asks for input, and thus, immediately follows our buffer overflow which we will execute in Part 2 of this series! Also worth mentioning, there is no JMP ESP / JMP RSP used in x64 buffer overflows like we’re accustomed to in x86/32 bit buffer overflows. We are using Return Oriented Programming (ROP), where we take advantage of RET instructions to execute ROP gadgets off the stack.
Also you will NOT see the address of our next instruction in RIP/EIP after successfully overflowing the buffer. You will likely see other registers overflowed with 0x41 though. Whereas in x86 buffer overflows you usually JMP to your memory address using RIP/EIP. It’s just different in x64 due to how registers are laid out. The next instruction will be your ROP gadget, so think of RIP/EIP in terms of the stack and the ROP gadget memory addresses we will “return” to, and not so much what value RIP/EIP holds.
Ok with that information behind us, let’s proceed! Double click here to set a breakpoint:
Great! Now scroll up a bit until you see this. It’s the function that calls the calculator! Make a note of this address:
Now, revisit your command prompt that is awaiting your input. Type something in and hit enter, like so:
You should hit your breakpoint we set earlier:
Now, Step Over the code twice by pressing F8 on your keyboard. If you’re on a laptop, it’s function + F8. Well, at least that’s the case for me lol. You should be here:
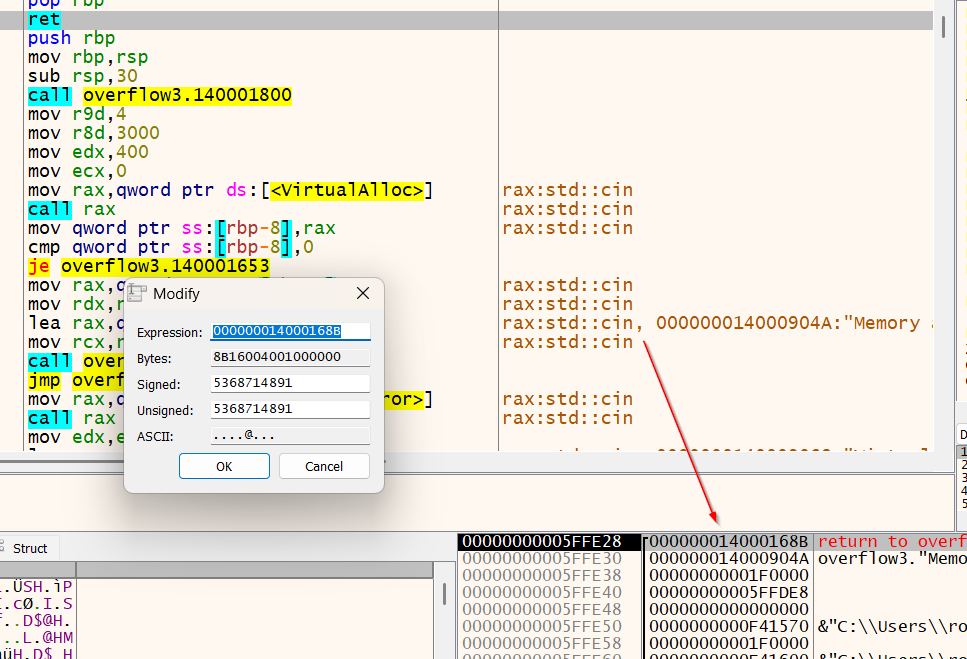
Double click here and a window will popup:
Change that value to the one I mentioned you should remember earlier. It will take us to our calculator function! After you enter the value, click 'OK'
Now, Let’s step through the function call, pressing 'F8' until you get here. Once you do, check out your command prompt output 😸
Press 'F8' once more to execute the calculator!
CONGRATS! If you made it this far you’ve completed part 1 of this series. I wanted to start out with the basics to give you a feel for using a debugger and also get the main exploitable program compiled and mess with it some. Next time, we will actually do the buffer overflow and control RIP! See you then 😃
Leave a comment